Evaluation Metrics
Model Training introduced four ways to measure how well a model performs: accuracy, precision, recall, and F1. They’re easier to grasp with actual numbers, so this page works through each one with a deliberately simple example. It’s worth getting comfortable with them here: in Unit 3, you’ll calculate the same measures for a model that finds names in Stevenson’s letters, and decide how far to trust it based on them.
Classification Example
Suppose you’ve trained a machine learning model to classify marbles by colour. To test it, you set aside a separate bag of 10 marbles that the model never saw during training, 6 blue and 4 orange, and ask it to classify each one (this is your test set). You get the following results:
| Model says: Blue | Model says: Orange | |
|---|---|---|
| Actually Blue | 4 | 2 |
| Actually Orange | 1 | 3 |
This table is called a confusion matrix (Jurafsky and Martin 2026, chap. 4). Here are the same results as marbles: each marble is its actual colour, placed in the column of what the model said it was. (Blue and Orange correspond to the positive and negative classes, respectively.)
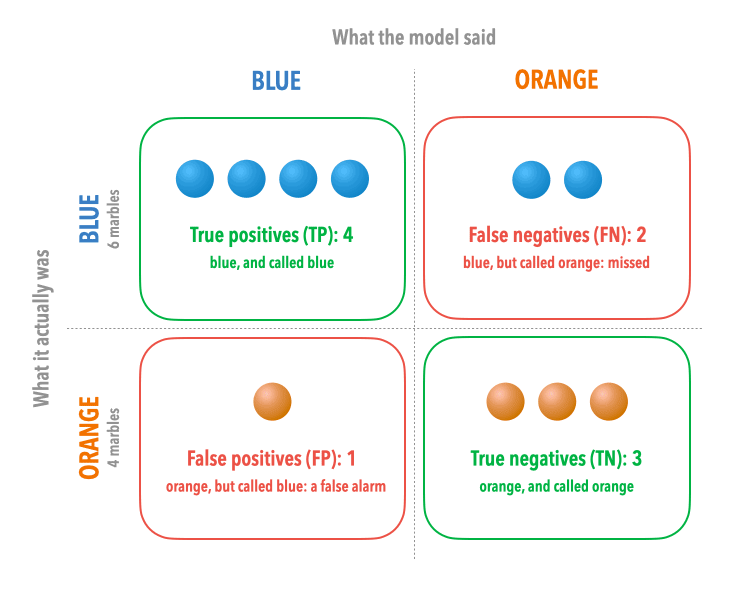
Each cell tells you something specific:
- 4 blue marbles called Blue: the model said Blue, and it was right. These are true positives (TP).
- 2 blue marbles called Orange: the model missed them. These are false negatives (FN).
- 1 orange marble called Blue: the model made a mistake. This is a false positive (FP).
- 3 orange marbles called Orange: the model said Orange, and it was right. These are true negatives (TN).
It helps to keep the logic of the names straight: true/false tells you whether the model was correct, positive/negative tells you what the model predicted. Here, positive means Blue: the class you’re trying to find.
Accuracy
Accuracy is the simplest metric: of all the marbles, what fraction did the model get right?
\[\text{Accuracy} = \frac{TP + TN}{\text{Total}} = \frac{4 + 3}{10} = \frac{7}{10} = 0.70\]
The model correctly classified 7 out of 10 marbles, giving an accuracy of 70%.
Accuracy is intuitive, but it can be misleading. Imagine a bag with 9 blue marbles and 1 orange marble: a model that always guesses Blue would score 90% accuracy while completely failing to detect any orange marbles. When classes are imbalanced, accuracy alone doesn’t tell the whole story (Saito and Rehmsmeier 2015).
Precision
Precision asks: of all the marbles the model called Blue, how many actually were blue?
\[\text{Precision} = \frac{TP}{TP + FP} = \frac{4}{4 + 1} = \frac{4}{5} = 0.80\]
When the model predicted Blue, it was right 80% of the time. Precision measures how trustworthy the model’s positive predictions are. A low precision means lots of false alarms.
Recall
Recall asks the opposite question: of all the marbles that were actually blue, how many did the model find?
\[\text{Recall} = \frac{TP}{TP + FN} = \frac{4}{4 + 2} = \frac{4}{6} \approx 0.667\]
The model found 4 of the 6 blue marbles, a recall of about 67%. The other two blue marbles were missed (called Orange). Recall measures coverage: how many of the things you were looking for you actually caught. A low recall means the model is missing things.
The Tradeoff: Precision vs. Recall
Precision and recall are often in tension. Imagine the model becomes more conservative and only calls a marble Blue when it is very certain. This improves precision (fewer false alarms) but will likely lower recall (more blue marbles go undetected). Conversely, making the model more eager to predict Blue improves recall, but lets more orange marbles slip through as false positives.
Which matters more depends on the task. If you are collecting every blue marble and plan to check the results by hand anyway, recall matters more: better to have some false alarms than to miss real blue marbles. If the results go straight into further analysis without checking, precision matters more.
F1 Score
The F1 score combines precision and recall into a single number. It is the harmonic mean of the two, a form of average that penalizes large imbalances between them (van Rijsbergen 1979, chap. 7; Jurafsky and Martin 2026, chap. 4):
\[F1 = 2 \times \frac{\text{Precision} \times \text{Recall}}{\text{Precision} + \text{Recall}} = 2 \times \frac{0.80 \times 0.667}{0.80 + 0.667} = 2 \times \frac{0.533}{1.467} \approx 0.727\]
The F1 score for our model is approximately 0.73 (or 73%). A perfect model would score 1.0, and a model that gets everything wrong would score 0.
The harmonic mean is used rather than a simple average because it is sensitive to imbalance. Take the cautious model above to an extreme: it calls only one marble Blue, and that marble is blue. Its precision is perfect (1 of 1, or 100%), but it found only 1 of the 6 blue marbles (a recall of about 17%). A simple average would give it a respectable-looking 58%. Its F1 is about 0.29, which better reflects how little it found.
Summary
| Metric | Value | What it asks |
|---|---|---|
| Accuracy | 0.70 | Overall, how often was the model right? |
| Precision | 0.80 | When it said Blue, how often was it correct? |
| Recall | 0.67 | Of all the blue marbles, how many did it find? |
| F1 score | 0.73 | Balanced summary of precision and recall |
All the metrics above are calculated with Blue as the positive class. In a real evaluation, you would often report metrics for each class separately, or an average across all classes. The core logic is the same: define what counts as a positive prediction, then count true positives, false positives, and false negatives from there.
From Marbles to Letters
In Unit 3, the marbles are the names in Stevenson’s letters, and the positive class is a type of name, such as person. A model reads each letter and marks the people it finds, with humans having annotated the same letters and their annotations treated as the correct answers:
- A true positive is a person the model marked who is also in the annotations, such as
Sidney Colvin. - A false positive is something the model marked as a person that isn’t one. In one letter, the model marks
Clever(fromnot so CLEVER perhaps) as a person. - A false negative is a person the model missed. In the same letter, it misses
COLVINinMY DEAR COLVIN. - True negatives would be every other word in the letters, correctly left unmarked. There are so many of them that accuracy would be close to 100% for almost any model, which is why the evaluation in Unit 3 uses only precision, recall, and F1, as is standard for this task (Tjong Kim Sang and De Meulder 2003).
If you came here from Model Training, you can pick up where you left off, at The Black Box Problem.
If you want to read more, the following are a good place to start:
- Google, Classification: Accuracy, Recall, Precision, and Related Metrics: a short lesson from Google’s Machine Learning Crash Course, with interactive examples of the trade-off between precision and recall.
- Jurafsky and Martin (2026), chapter 4: the textbook treatment of these measures, including how to average them across several classes. It assumes a little more mathematics than this page.